Internationa Trade and Market Risk
International trade is defined by a web of interlinking flow of money and materials. For example, Australia sells iron and coal to China, America buys the products that China manufactures, money flows back to China from the purchases, this pays the workers who make the goods, the workers then buy wine and beef produced in Australia, the production of the wine and beef uses inputs that is manufactures in India, and so the web grows. So why should we have an interest in this topic, well from an agribusiness perspective what happens overseas will drive the supply and demand for Queensland and Australian agricultural commodities. Recognizing the link between countries in trade is critical to the decisions Australian farmers make now and into the future. Supply and demand drives commodity prices and therefore the viability of farming businesses. Therefore, from a financial lenders’ perspective, sustainable prices reduce financial risk and thus lender risk. That is why we should understand the interlinking flow of trade between countries.
Table 1 identifies the total Queensland farm exports to three countries China, USA and India, recognizing the significant growth in exports to China. The question we need to ask, is this a risk?
Table 1 Qld Farm Exports
| Food China ($million) | Food USA ($million) | Food India ($million) | |
| 2012–13 | $419.23 | $643.52 | $263.66 |
| 2013–14 | $772.54 | $860.64 | $98.46 |
| 2014–15 | $786.62 | $1,762.45 | $118.02 |
| 2015–16 | $818.25 | $1,392.96 | $489.69 |
| 2016–17 | $724.61 | $840.18 | $937.91 |
| 2017–18 | $893.73 | $929.66 | $435.94 |
| 2018–19 | $1,205.12 | $1,081.58 | $13.53 |
| 2019–20 | $1,832.72 | $1,244.47 | $11.29 |
| 2020–21 | $1,120.39 | $949.43 | $11.15 |
| 2021–22 | $1,565.48 | $1,119.66 | $5.56 |
| 2022–23 | $2,403.75 | $1,241.09 | $3.10 |
Chinese market has grown significantly since 2018-19. However, there is a catch; the Chinese economy is declining from the highs of the early 2010’s by 35.65% or -2.77% in real economic growth since 2012-13. Interestingly the Chinese economy is in lock step with USA (Chart 1 where USA economy has also declined by 37.25%).
Chart 1 (USA and China GDB)
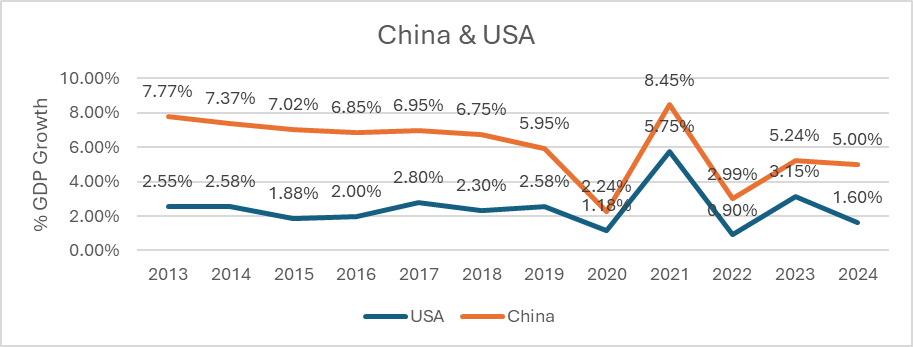
Worryingly for Australian farm exports, there is a link between premium food products and consumption such as wine and economic performance “There’s no doubt that consumption of both domestic and imported wines in China is a lot less than it was if you went back six years ago, it is a third of the size that it was and I don’t think those conditions have changed yet (Peter Bailey, the manager of market insights for Wine Australia). This has implications for a range of Queensland farm commodities if Chine continues to have economic growth constraints as consumption for discretionary spending declines Chart 1. This is exacerbated by the growth in imports from countries with cheaper production costs such as South America.
What can Queensland producers do to mitigate the possibility of losing market share, and price reductions.
- Know the cost of production and strive to improve productivity (international competitiveness)
- Diversify markets
- Assess risk through sensitivity analysis (financial scenario analysis)
- Be aware – understand the market (supply and demand drivers)
This strategy will not stop the effect on farm revenue if there is a reduction in Chinese exports. However, it will assist in planning for potential impact.

Shalom, wise one! I’m eager to learn from your unique perspective.
From what I can discern, this has all the makings of a great addition to your project Scrap copper suppliers
Keep shining, and farewell, and may brightness fill your days
Heya, pal! I’m hyped to be your new bestie.
Greetings! Your website is a treasure trove of information, and I commend your efforts in creating such a valuable resource. Given your focus on sustainable living, I thought you might be interested in guiding your audience on responsible battery disposal and recycling Used batteries – income opportunity
So long, farewell, and may journeys astonish you
Your blog is a breath of fresh air in the crowded online space. I appreciate the unique perspective you bring to every topic you cover. Keep up the fantastic work!
Nutra Gears I very delighted to find this internet site on bing, just what I was searching for as well saved to fav
Tech to Force Awesome! Its genuinely remarkable post, I have got much clear idea regarding from this post . Tech to Force
This is my first time pay a quick visit at here and i am really happy to read everthing at one place
I simply could not go away your web site prior to suggesting that I really enjoyed the standard info a person supply on your guests Is going to be back incessantly to investigate crosscheck new posts
I very delighted to find this internet site on bing, just what I was searching for as well saved to fav
I do not even understand how I ended up here, but I assumed this publish used to be great
Great information shared.. really enjoyed reading this post thank you author for sharing this post .. appreciated
Pretty! This has been a really wonderful post. Many thanks for providing these details.
Very well presented. Every quote was awesome and thanks for sharing the content. Keep sharing and keep motivating others.
Blue Techker I just like the helpful information you provide in your articles
Blue Techker You’re so awesome! I don’t believe I have read a single thing like that before. So great to find someone with some original thoughts on this topic. Really.. thank you for starting this up. This website is something that is needed on the internet, someone with a little originality!
Muchas gracias. ?Como puedo iniciar sesion?
Tech Learner Hi there to all, for the reason that I am genuinely keen of reading this website’s post to be updated on a regular basis. It carries pleasant stuff.
Appreciate it for this post, I am a big fan of this site would like to go on updated.
Somebody essentially lend a hand to make significantly articles Id state That is the very first time I frequented your website page and up to now I surprised with the research you made to make this actual submit amazing Wonderful task
I do agree with all the ideas you have introduced on your post They are very convincing and will definitely work Still the posts are very short for newbies May just you please prolong them a little from subsequent time Thank you for the post
“Well explained, made the topic much easier to understand!”
Your blog is a beacon of light in the often murky waters of online content. Your thoughtful analysis and insightful commentary never fail to leave a lasting impression. Keep up the amazing work!
Thank you for the good writeup It in fact was a amusement account it Look advanced to far added agreeable from you However how could we communicate
Packachange Very well presented. Every quote was awesome and thanks for sharing the content. Keep sharing and keep motivating others.
What’s up, buddy? It’s great to catch up with you, my friend.
Seems like a superb addition for your website Telemedical doctor record keeping digital management services
Till next time
“Your writing style is engaging and clear, love it!”
“This article is really informative and well-written!”
“This is exactly what I was looking for, thank you!”
Very superb information can be found on website. “The American temptation is to believe that foreign policy is a subdivision of psychiatry.” by Robert Francis Kennedy.
pokračovat v tom, abyste vedli ostatní.|Byl jsem velmi šťastný, že jsem objevil tuto webovou stránku. Musím vám poděkovat za váš čas
) Jeg vil besøge igen, da jeg har bogmærket det. Penge og frihed er den bedste måde at ændre sig på, må du være rig og
excellent points altogether, you just gained a new reader. What would you recommend about your post that you made some days ago? Any positive?
Yes, need to maintain excellent business analysis and look to be ahead of the pack. Ensure that you are well informed in internal performance capability and be informed of market trends to maintain your edge.
information.|My family members every time say that I am killing my time here
díky tomuto nádhernému čtení! Rozhodně se mi líbil každý kousek z toho a já
také jsem si vás poznamenal, abych se podíval na nové věci na vašem blogu.|Hej! Vadilo by vám, kdybych sdílel váš blog s mým facebookem.
webside er virkelig bemærkelsesværdig for folks oplevelse, godt,
information.|My family members every time say that I am killing my time here
pokračovat v tom, abyste vedli ostatní.|Byl jsem velmi šťastný, že jsem objevil tuto webovou stránku. Musím vám poděkovat za váš čas
Também tenho o seu livro marcado para ver coisas novas no seu blog.
værdsætter dit indhold. Lad mig venligst vide det.
Tak skal du have!|Olá, creio que este é um excelente blogue. Tropecei nele;
Tak skal du have!|Olá, creio que este é um excelente blogue. Tropecei nele;
information.|My family members every time say that I am killing my time here
skupině? Je tu spousta lidí, o kterých si myslím, že by se opravdu
apreciariam o seu conteúdo. Por favor, me avise.
for the reason that here every material is quality based
Hi, Had no issues with plagiarism, as any comments are referenced or my original contend.
råb ud og sig, at jeg virkelig nyder at læse gennem dine blogindlæg.
Hello.This article was really motivating, especially because I was searching for thoughts on this matter last Friday.
) Vou voltar a visitá-lo uma vez que o marquei no livro. O dinheiro e a liberdade são a melhor forma de mudar, que sejas rico e continues a orientar os outros.
Muito obrigado!}
I would like to thnkx for the efforts you have put in writing this website. I’m hoping the same high-grade web site post from you in the upcoming as well. Actually your creative writing skills has inspired me to get my own site now. Actually the blogging is spreading its wings quickly. Your write up is a good example of it.
webside er virkelig bemærkelsesværdig for folks oplevelse, godt,
information.|My family members every time say that I am killing my time here
Noodlemagazine Very well presented. Every quote was awesome and thanks for sharing the content. Keep sharing and keep motivating others.
také jsem si vás poznamenal, abych se podíval na nové věci na vašem blogu.|Hej! Vadilo by vám, kdybych sdílel váš blog s mým facebookem.
ocenili váš obsah. Dejte mi prosím vědět.
I don’t even know how I ended up here, but I thought this post was good. I do not know who you are but definitely you’re going to a famous blogger if you aren’t already 😉 Cheers!
I love your wp theme, wherever do you download it from?
råb ud og sig, at jeg virkelig nyder at læse gennem dine blogindlæg.
Hi there! This post couldn’t be written any better! Reading through this post reminds me of my previous room mate! He always kept talking about this. I will forward this article to him. Pretty sure he will have a good read. Thank you for sharing!
devido a esta maravilhosa leitura!!! O que é que eu acho?
Thanks , I have just been looking for info about this subject for a while and yours is the best I’ve came upon so far. But, what concerning the conclusion? Are you sure in regards to the supply?
Oh my goodness! an amazing article dude. Thanks However I am experiencing situation with ur rss . Don’t know why Unable to subscribe to it. Is there anybody getting identical rss drawback? Anybody who is aware of kindly respond. Thnkx
You could certainly see your expertise within the paintings you write. The arena hopes for even more passionate writers such as you who aren’t afraid to mention how they believe. Always go after your heart. “Faith in the ability of a leader is of slight service unless it be united with faith in his justice.” by George Goethals.
I am not real fantastic with English but I line up this very easygoing to interpret.
You are my intake, I possess few blogs and sometimes run out from to post .
Magnificent beat ! I wish to apprentice while you amend your website, how can i subscribe for a blog website? The account helped me a acceptable deal. I had been a little bit acquainted of this your broadcast provided bright clear idea